Example map
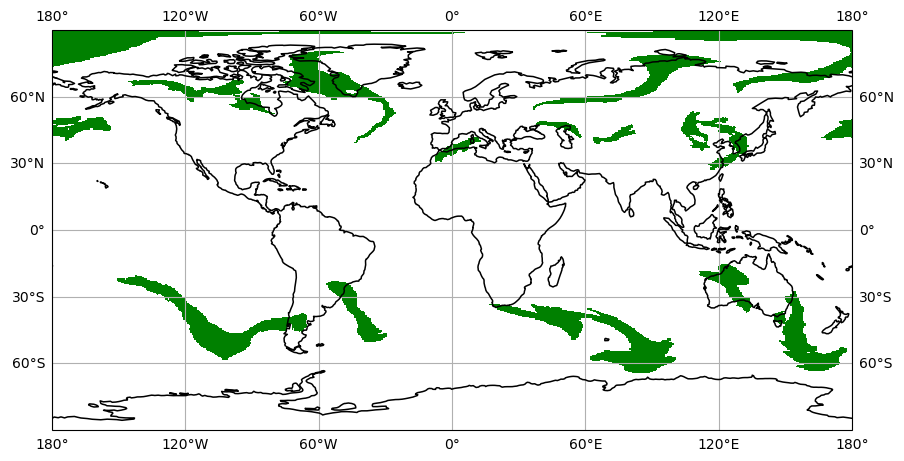
Using ARTMIP Tier 1 data, plot a global example map of AR outlines at 2012-07-11 00:00 UTC.
import xarray as xr
import matplotlib.pyplot as plt
import matplotlib.colors as colors
import cartopy.crs as ccrs
ars_2012_fname = 'MERRA2.ar_tag.Mattingly_v2.3hourly.20120101-20121231.nc4'fig = plt.figure(figsize=(8,12))
ax = fig.add_axes([0,0,1,1], projection=ccrs.PlateCarree())
ax.set_extent((-180,180,-90,90), crs=ccrs.PlateCarree())
ax.coastlines(resolution='110m', color='k', linewidth=1.1, zorder=8)
_= ax.gridlines(zorder=5, draw_labels=True)
ds = xr.open_dataset(ars_2012_fname).sel(time='2012-07-11 00:00')
ars_fill = plt.pcolormesh(
ds.lon, ds.lat, ds.ar_binary_tag,
transform=ccrs.PlateCarree(),
cmap=colors.ListedColormap(['None','green'])
)